Macroeconomic Conjecture in Turkey
The Turkish economy has been effected by chronic high inflation for over two decades. Past programs designed to fight inflation have never been successfully carried through, that imposes a heavy burden on the economy, and society, causing inequality of incomes and distorting the planning horizons of investors and savers. Therefore the economy operates under the constant threat of instability, discouraging foreign and domestic investment. This chronic weakness in the public finances, resulting from an inflation- eroded tax base, has limited spending on basic education, health and infrastructure. The economy has performed a significant performance even in a global financial crisis exists, and the loss of a major export market in Russia. The sudden effects of these developments are pressures on the domestic currency and a rapid liquidity crunch. When all these combine with political uncertainty, the result is high real interest rates that have been in the 40%- 50% band over the past 6 months. It is expected a declining trend in inflation to continue in the coming months, some increase will be partly offset by a slowdown in agricultural product price in summer.
The important thing is “ What is going to happen after elections.” The economy will depend on the outcomes of elections and the program of the new government. With the previous two governments, a determined policy was implemented, especially in the inflation and fiscal issues. The public recognizes the tax collection as a government policy. Although agricultural policies as high pricing than global average, social security system, banking sector improvements, lack of privatization remain unsolved. The first step to achieve these problems requires a credible government that has a consensus from the public after the elections. The Turkish market is still undervalued, and therefore a significant upside potential in the post-election period is to be expected. the market’s direction will depend on the scenarios that will occur post-elections, one way a consistent , reform based government that leads to reforms; the other way a government that is in the absence of reforms that means the flow of foreign capital is limited and there is still an expansion but in a limited extent.
Turkey has successfully weathered major external shocks and made impressive progress in reducing inflation. The policies outlined for the first half of 1999 will consolidate these gains. But much remains to be done to tackle the fiscal and structural roots of Turkey’s chronic inflation, and the cost of inaction is high. A
Reinvigoration of the macroeconomic and structural reform effort after the elections is needed without any delay.
As soon as Turkey is able to move forward in a decisive way on these much-needed and long-delayed reforms in the framework of a comprehensive disinflation program, the International Monetary Fund will be able to provide strong and concrete support. In the meantime, IMF will cooperate closely with the Turkish authorities to develop a program for the post-election period that can be supported with Fund resources. This work will be pursued in the course of planned visits in the coming months to Washington by the Turkish authorities and in the context of regular reviews.
When we look at the fiscal policy, the budget revenues displayed only a 3.1% increase, due to declining tax revenues, in the wake of the removal of the withholding tax and the lowered income bracket. On the other hand, the expenditures revealed a 26.8% surge. 75.6% of the revenues was dragged away by domestic interest expenses and the transfers to the social security institutions expended by 20.6%.
In the monetary policy, The CB’s analytical balance sheet indicates that assets decreased TL 113 trillion in the February 23-March 2 period, primarily due to a TL 280 trillion reduction in domestic assets. The main reason was, the decrease in the cash credits to the public sector. Another change was seen in the public sector deposits account. Due to VAT collection and borrowing exceeding treasury redemption’s, this account mainly composed of treasury deposits, increased to TL 248 trillion. As opposed to the money absorbed by the treasury, the CB injected money to the system by buying dollars and through open market operations. Despite the increase in OMO, net domestic assets dropped to TL -48 trillion. This figure occurred by the absorption of money from the market by the CB.
Sale dominated F/X trends were seen in the exchange rate policy. The F/X market continued to witness the sales initiated by the banks, which appeared to shift to a slower tempo, in the February. The CB’s interventions ruled the market again.
Capacity utilization hit the bottom in January with 71.3% for the first time since 1994 crisis. The slippage in the factory use in January was on the privately owned enterprises, slashing their capacity use from 73.8% to 60.5%, while the public sector expanded its data from 78.7% to 85.2%.
The other indicator is the inflation. January inflation was revealed at 3.1%. The WPI rode by 3.6. Moreover, the CPI surged by 4.8%. The annual inflation dropped to 50% in the WPI and 65.9% in the CPI.
Domestic debt stock surged to US$37.8bn and the external debt stock reached US$100.95bn at 3Q98-end.
Markowitz Optimization Program Analysis
We selected the periods beginning from October 1998 to March 1999 on a weekly basis. The reason we have selected these periods lies on the “Early Election” speculation. It was started at the first week of the October 1998, in which the elections will be made in 18th April 1999.
The data which we used for running Markowitz is on the appendix.
We expect a favorable condition after the elections. Because of this reason, we
agree that using stocks will yield better profits. However, for a caution we
also use the bonds. In the following table you can see our portfolio.
Security Analysis
We have selected Akbank, Cukurova Elektrik, Vestel and Yapi Kredi Bank.
In the following paragraphs we will explain why we have chosen these
securities.
While we were creating our portfolio we have used information from
various magazines such as: Ekonomist, Aktuel Para, Borsamatik and Paramatik. We
do not trust the suggestions by these magazines. But we used their macro-market
and stock-market analysis. For example one of the Ekonomist’s analysis was
interesting. (28 Feb-6 March). They made 100 stock’s risk analysis.
I. Akbank
T.A.S:
It has a total of 506 branches which are connected by on-line-real time system. Total capital and reserves increased to 111,111 billion TL. In 1997 new banking products and services are introduced. These services and products covers home and office banking, namely through video telephone (Aktel), television banking (Akvizyon), and pc banking (Akpc). Different from the other banks it is the only issuing agent for American Express (which is a prestigious card) in Turkey. Akbank was provided $250 million worh of syndication credit with the participation of world-wide known 34 banks. (IMKB Sirketler Yilligi – 1998)
|
|
1996 |
1997 |
1998 |
|
Net
Profit After Tax (MillionTL) |
37,756,270 |
89,817,556 |
197,897,724 |
IMKB Sirketler Yilligi-1998 and Ekonomist no:9
When its 3 month weekly price change are analyzed we will expect a 1.006% return in a week if its performance continuous like this but with a risk of 0,405%. If all things go well we expect a maximum return of 1.411% (1.006+0.405). Furthermore if all things go unfavorable we expect a gain of 0.601 % (1.006-0.405). Its Beta is 0.961, which indicates that Akbank’s price fluctuations are in the same direction with ISE’s index.(Borsa Market/21-27March).
0 0.601 1.006 1.411
|
|
|
|
|
|
|
|
|
|
|
|
Recession Expected Boom
Thus, we conclude that there is no loss incurring even in a recession period of the economy. We see that the expected return and the return in a boom session of an economy will yield a good profit for us.
II. Cukurova Elektrik A.S.:
Its main business area is producing and distributing electricity. It is officially privileged. Its productivity is affected by the location’s rain condition, because it is producing electricity by hydraulic. (In the current years average rainy days increased, thus we expect a productivity increase). Currently the company produces electricity from its 6 stations. Currently Cukurova Elektrik has a continuing investment (Berke Baraji). Total cost of investment is $537 million and its $290 million was completed. It was estimated that the project will finish in 1999. (IMKB Sirketler Yilligi – 1998)
|
|
1993 |
1994 |
1995 |
1996 |
1997 |
1998 |
|
Net Profit After Tax MillionTL |
590,165 |
8,736 |
538,409 |
5,446,639 |
12,957,796 |
10,394,483 |
IMKB Sirketler Yilligi-1998 and Ekonomist no:9
For us this is the riskiest stock in our portfolio. When its 3 month weekly price change are analyzed we will expect a 0.616% return in a week if its performance continuous like this. But its risk is 0,727%. If all things go well we expect a maximum return of 1.343% (0.616+0.727). But also if all things go unfavorable we expect a loss of 0.111 % (0.616-0.722). When we look its Beta we found the rate as 0.585, which indicates that Cukurova’s price fluctuations are slower than ISE’s index.(Borsa Market/21-27March).
-0.111 0 0.616 1.343
|
|
|
|
|
|
|
|
|
|
|
|
R E B
Thus, we conclude that the loss from Cukurova will be much more lower than the gain. We expect an average positive earning from Cukurova although it is known as a risky asset.
III. Vestel A.S.:
Vestel produces and sells televisions and monitors; imports and sells audio, video and white-goods. Vestel has an increasing trend in television production from 567,387 units in 1995 to 1,000,043 units in 1996. Exports reached to 89 million dollars and approximately 135 million dollars in 1995 and 1996 respectively. Also it increased its monitor production to 10,500 units in the last quarter of 1996. In addition to this, company increased both television and monitor production to 2,203,926.
|
|
1993 |
1994 |
1995 |
1996 |
1997 |
1998 |
|
Net Profit After Tax MillionTL |
33,241 |
-67,349 |
305,293 |
2,078,709 |
7,703,676 |
11,237,709 |
IMKB Sirketler Yilligi-1998 and Ekonomist no:9
When its 3 month weekly price change are analyzed we will expect a 0.458% return in a week if its performance continuous like this but with a risk of 1,090%. If all things go well we expect a maximum return of 1.548%(0.458+0.1.090). Furthermore, if all things go unfavorable we expect a loss of 0.632% (0.458-1.090). Its Beta is 0.936, which indicates that Vestel’s price fluctuations are in the same direction with ISE’s index.(Borsa Market/21-27March).
-0.632 0 0.458 1.548
|
|
|
|
|
|
|
|
|
|
|
|
R E B
Thus, we conclude that even we may see that a loss may occur, we expect future gains. Since, Vestel`s investment to the computer industry (which is a profitable and growing sector) as building an assembly plant, we expect a future gains from investing this stock. Vestel will attempt to a world-wide known and the biggest computer fair Cebit, in Hannover. This shows us that how the firm is serious in their scope to computer sector. Moreover, in this month it is said that Vestel will make an export aggrement with USA.
IV. Yapi ve Kredi Bankasi A.S.:
Yapi Kredi’s total assets, by an increase of %123, reached 1.240 trillion. It benefits from the highest service and commission income of the banking sector. Moreover to this, there is an increase of 85% in the demand to the deposits as of the year end 1997. The bank maintained its leading position in credit cards market in terms of both outstanding receivables and transaction volume with 1.4 million active credit cards. Also, total deposits increased by 114%.
|
|
1995 |
1996 |
1997 |
1998 |
|
Net Profit After Tax MillionTL |
16,225,432 |
22,724,428 |
61,707,502 |
73,359,052 |
IMKB Sirketler Yilligi-1998 and Ekonomist no:9
When its 3 month weekly price change are analyzed we will expect a 1.245% return in a week if its performance continuous like this but with a risk of 0.875%. If all things go well we expect a maximum return of 2.12% (1.245+0.875). Furthermore, if all things go unfavorable we expect a gain of 0.37%(1.245-0.875). Its Beta is 1.261, which indicates that Yapi Kredi’s price fluctuations will be same direction with ISE’s index but it will be faster than it.(Borsa Market/21-27March).
0 0.37 1.245 2.12
|
|
|
|
|
|
|
|
|
|
|
|
R E B
When looked at the all balance sheets of our stocks, it will be easily realized that Yapi Kredi has the highest net income. Thus we expect a highest net income in the 1999. Besides this, the above analysis of risk and return, Yapi Kredi also offers a profit in a recession period.
Stock Allocation
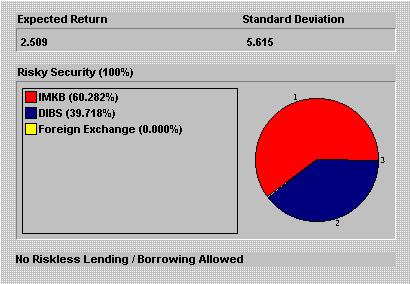
According
to the Markowitz program we have created a basket which contains 60% of IMKB.
This is nearly 4,800,000,000 TL. Below you will find the allocation of this
money for each stock. In the light of the previous analysis, we concluded these
portions:
Government Bond Allocation
After allocating 4,797,096,000 (which is nearly 60% of 8,000,000,000), we will invest the 3,202,904,000 (which is nearly 40%) to the government bonds. According to our selection we will not use foreign exchange.
For bond we have selected Bond Number 634, its current sale price is 913,725 TL. It has a 64% yearly simple interest. Its maturity date is 28/04/1999 and value will be 973,004 TL. Thus we will buy 3505*913,725 TL=3,202,606,125 TL. At the end we will gain 207,772,895 TL. So our return on investment to bond is; 6.48%. (these data was taken from Isbankasi Interaktif at http://www.isbank.com.tr)